On the open-source Penobscot dataset — a rare public case with both sparse 2D acquisition lines and a matching 3D survey for ground truth — ORCA's probabilistic horizon reconstruction lands its uncertainty bands within ±5 pp of the 80 % coverage target on all four target horizons, with RMS at picks below the 4 ms sample interval. A neural refinement further reduces point error against dense 3D ground truth by 39.7 % on logan_canyon, the structurally liveliest of the four. Applied to the full seismic volume, the same workflow recovers visible geological structure in a first-pass reconstruction.
The challenge
Operators routinely make exploration and reservoir decisions in areas where seismic coverage is sparse — vintage 2D acquisitions, irregular line geometry, no 3D survey. The classical approach to filling the inter-line gap is to deliver a single best-guess answer: Radial Basis Function (RBF) interpolation, kriging, spline, or a hand-drawn surface.
A single best-guess deliverable obscures the very uncertainty that drives the decision. An operator looking at one reconstructed horizon cannot tell which features are tightly constrained by 2D data and which are inherited from the interpolator's smoothness prior; an exploration manager looking at one reconstructed seismic volume cannot tell whether a structural closure is based on data or assumption. Reservoir economics, drill, acquire, defer decisions, and CCUS site approvals all require an honest answer to how much of this is the data, and how much is the prior?
Our approach
This case study applies ORCA — Atlas Deep Geo's implementation of physics-informed AI for subsurface reconstruction — to the 2D-to-3D problem class.
For the 2D-to-3D problem we address the challenges in two phases, sharing one probabilistic foundation. Each stage delivers a distribution of plausible outcomes and the associated uncertainty. When ground truth data is available the results are empirically calibrated against held-out ground truth.
Stage 1a — Smooth probabilistic baseline. A probabilistic prior fits the 2D horizon picks and produces a distribution of plausible 3D surfaces with a per-location uncertainty map. The calibration target — 80% credible-band coverage — is validated against held-out picks.
Stage 1b — Neural network refinement. ORCA's U-Net recovers the short-wavelength horizon character — channel boundaries, fault expression — that classical smoothing methods cannot extract from sparse 2D lines. The output is a refined per-horizon surface, validated against dense 3D ground truth held out from training.
Stage 2 — Seismic-volume reconstruction. The same workflow scales from horizons to the full seismic volume. ORCA's neural network recovers the short-wavelength seismic character that classical smoothing methods cannot extract from sparse 2D traces alone, producing a predicted volume that fills the inter-line gaps.
The connective thread between the stages is the calibrated uncertainty. A horizon reconstruction that produces a P50 surface alone is one number; a horizon reconstruction whose P10–P90 band has been validated to land its claims honestly is a foundation the volumetric stage can build on. The discipline is the same across stages — give back a distribution of plausible outcomes, validated against ground truth where it exists.
Validating on Penobscot
Penobscot is rare among public surveys in that it contains both a 3D seismic volume and a set of 2D seismic lines acquired over the same area with comparable acquisition — real 2D lines, real wavelet, real noise, and a real 3D volume to validate against.
That combination is exactly what this workflow needs. Each stage can be tested independently against the same ground truth: horizons reconstructed from 2D picks, and the seismic volume reconstructed from 2D traces.
Stage 1a · Smooth probabilistic baseline
Stage 1a starts from horizon picks on the 2D lines. A pre-flight QC step characterizes the consistency between the 2D and 3D acquisitions and applies a per-line time and amplitude correction; without it, the systematic differences between the two acquisitions (different processing, ~12 ms median time shift, ~4.7× amplitude scaling, different wavelets) would dominate any downstream comparison.
Each calibrated horizon is then reconstructed as a probabilistic surface. The prior is an anisotropic Gaussian process; the kernel is either a single anisotropic Matérn or a sum of two Matérn components, selected per horizon based on the empirical variogram. The output is a posterior distribution over the full 3D surface — a mean estimate, a per-location uncertainty, and a set of posterior samples from which P10 / P50 / P90 surfaces are read off directly.
Baccaro is the one exception in the four target horizons: its 2D↔3D residual is depth-variant, not just a static shift, so the per-line calibration cannot close its mean offset. It is reported in the calibration validation that follows — where the GP behaves correctly despite biased inputs — and is flagged here once as a known caveat.
Workflow
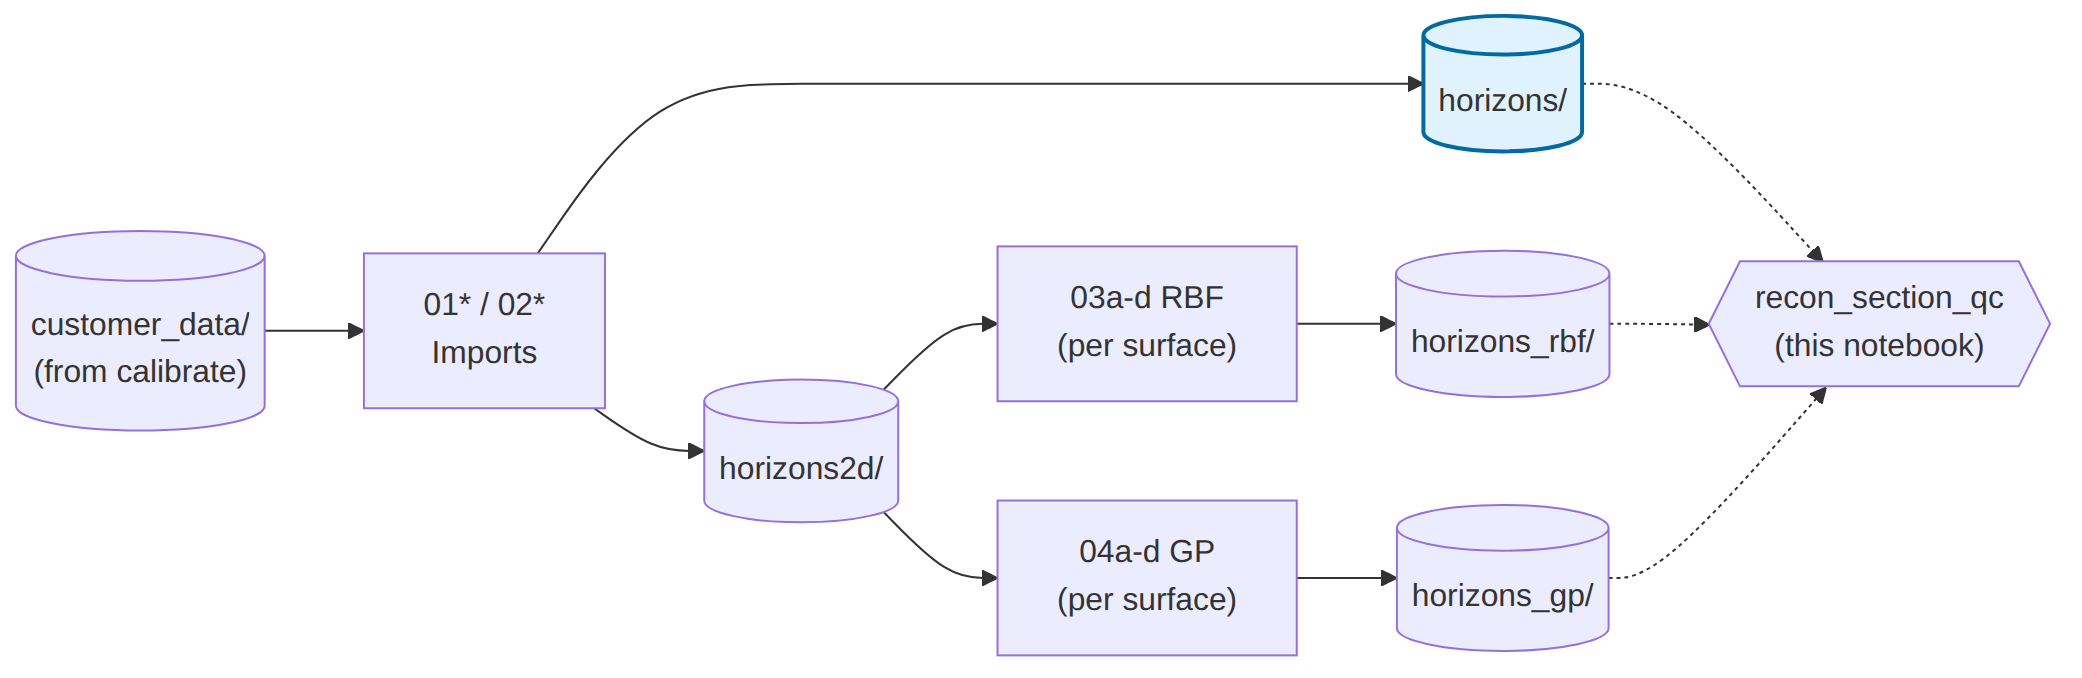
Reference sections
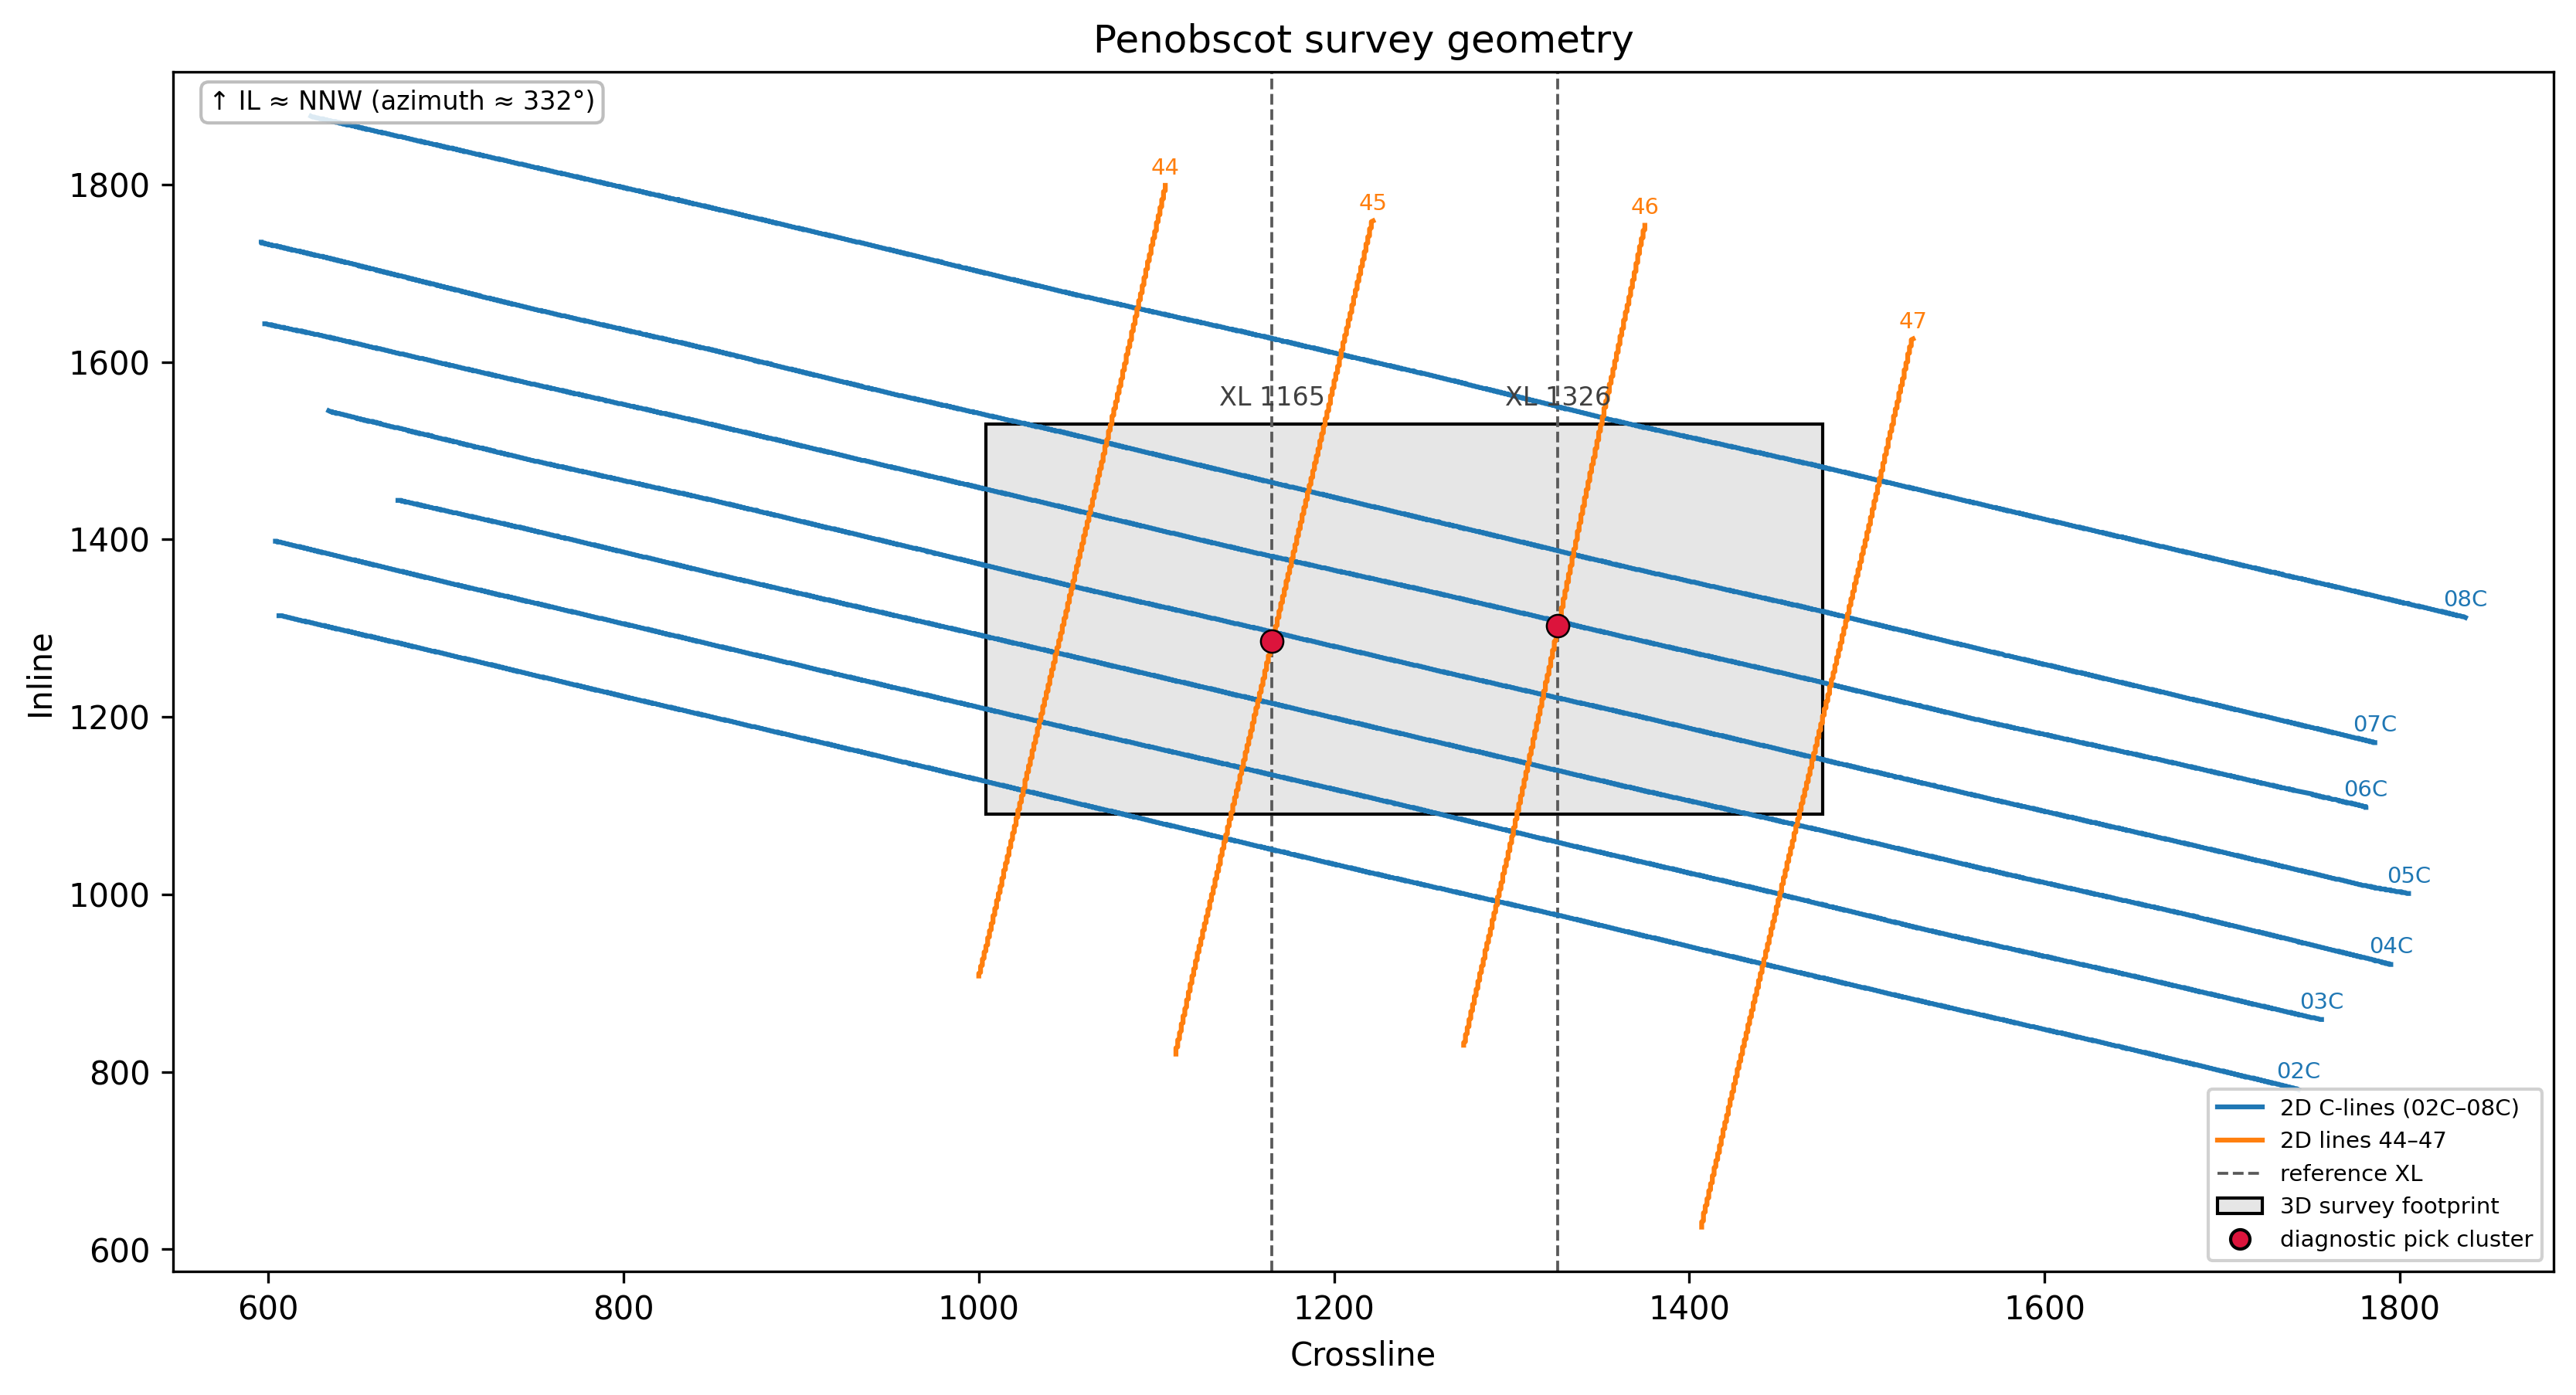
Penobscot's 11 × 2D lines fall into two groups: seven longer C-numbered lines (02C–08C) running roughly along the crossline direction, and four shorter numeric lines (44–47) oriented along the inline direction. Two reference crosslines — XL 1165 and XL 1326 — were chosen because each crosses the primary fault on logan_canyon at an inline where multiple 2D-line picks cluster; lines 45 and 46 in particular reach those reference XLs at the fault.
The section view is what an interpreter actually works on — well-trajectory planning, fault mapping, and closure interpretation along a specific crossline. The GP's P10–P90 envelope around the mean tells them per-trace where to expect the true horizon to deviate. A classical interpolation gives one curve and no way to size that deviation; here an operator can plan a well or size a closure against an explicit confidence corridor.
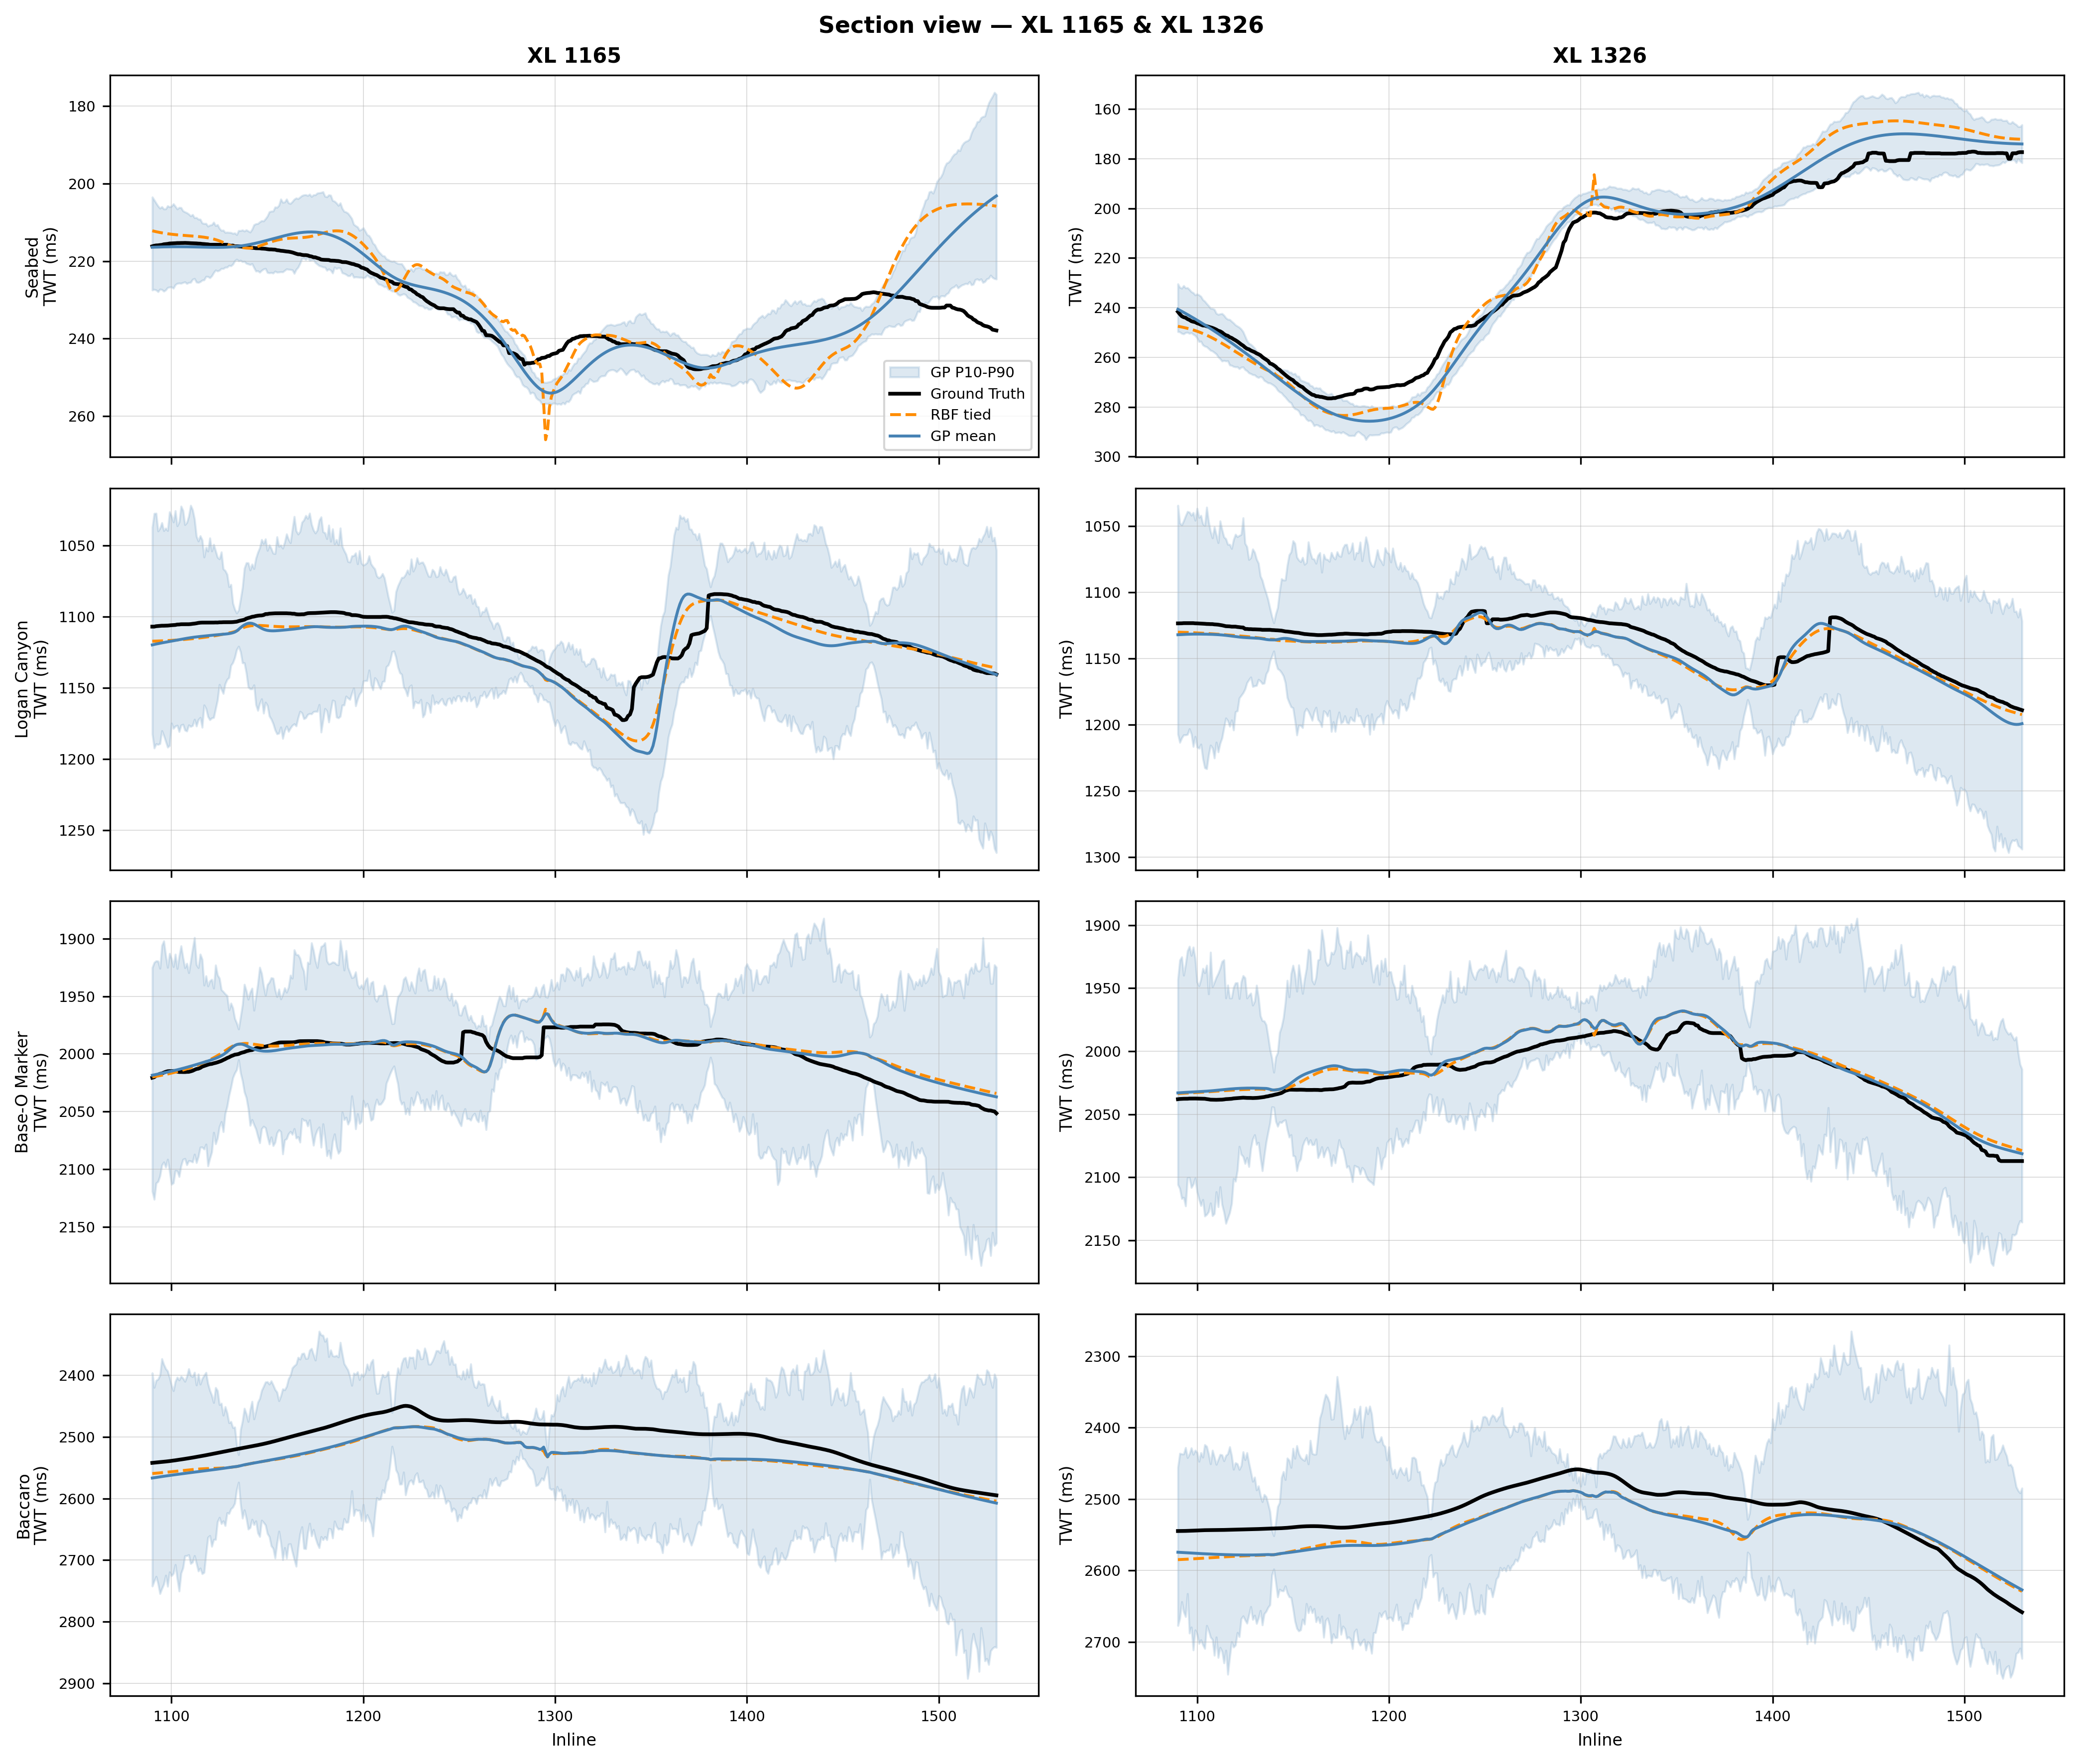
The envelope visibly narrows where 2D-line crossings cluster and broadens toward the survey edges. It collapses most visibly at the fault — IL 1285 on XL 1165 and IL 1303 on XL 1326 — where line 45 / 46 picks coincide with the nearest C-line picks (05C and 06C).
Seabed at the right edge of XL 1165 diverges from truth. The 2D acquisition extends past the 3D survey footprint, picking up the seabed shoaling toward shore where the 3D survey doesn't cover. The reconstruction inherits that context from the 2D picks; the 3D ground truth doesn't have it, so the two curves diverge at the survey edge — visible in the figure but not a reconstruction error.
Plan view
The workflow delivers an uncertainty-aware reconstruction of each horizon from 2D picks alone. The same posterior appears in two complementary forms: P10–P90 bands tracing the GP mean in the section view above, and σ here in plan. σ is both the model's confidence at each location and the expected deviation of the truth from the GP mean — low where 2D data constrains the surface, high where the prior is filling in. Classical interpolation gives an interpreter one surface and no way to size that deviation; this gives a surface paired with its reliability map — the substrate downstream work needs for depth conversion, gross-rock-volume estimates, closure mapping, and value-of-information cases for additional acquisition.
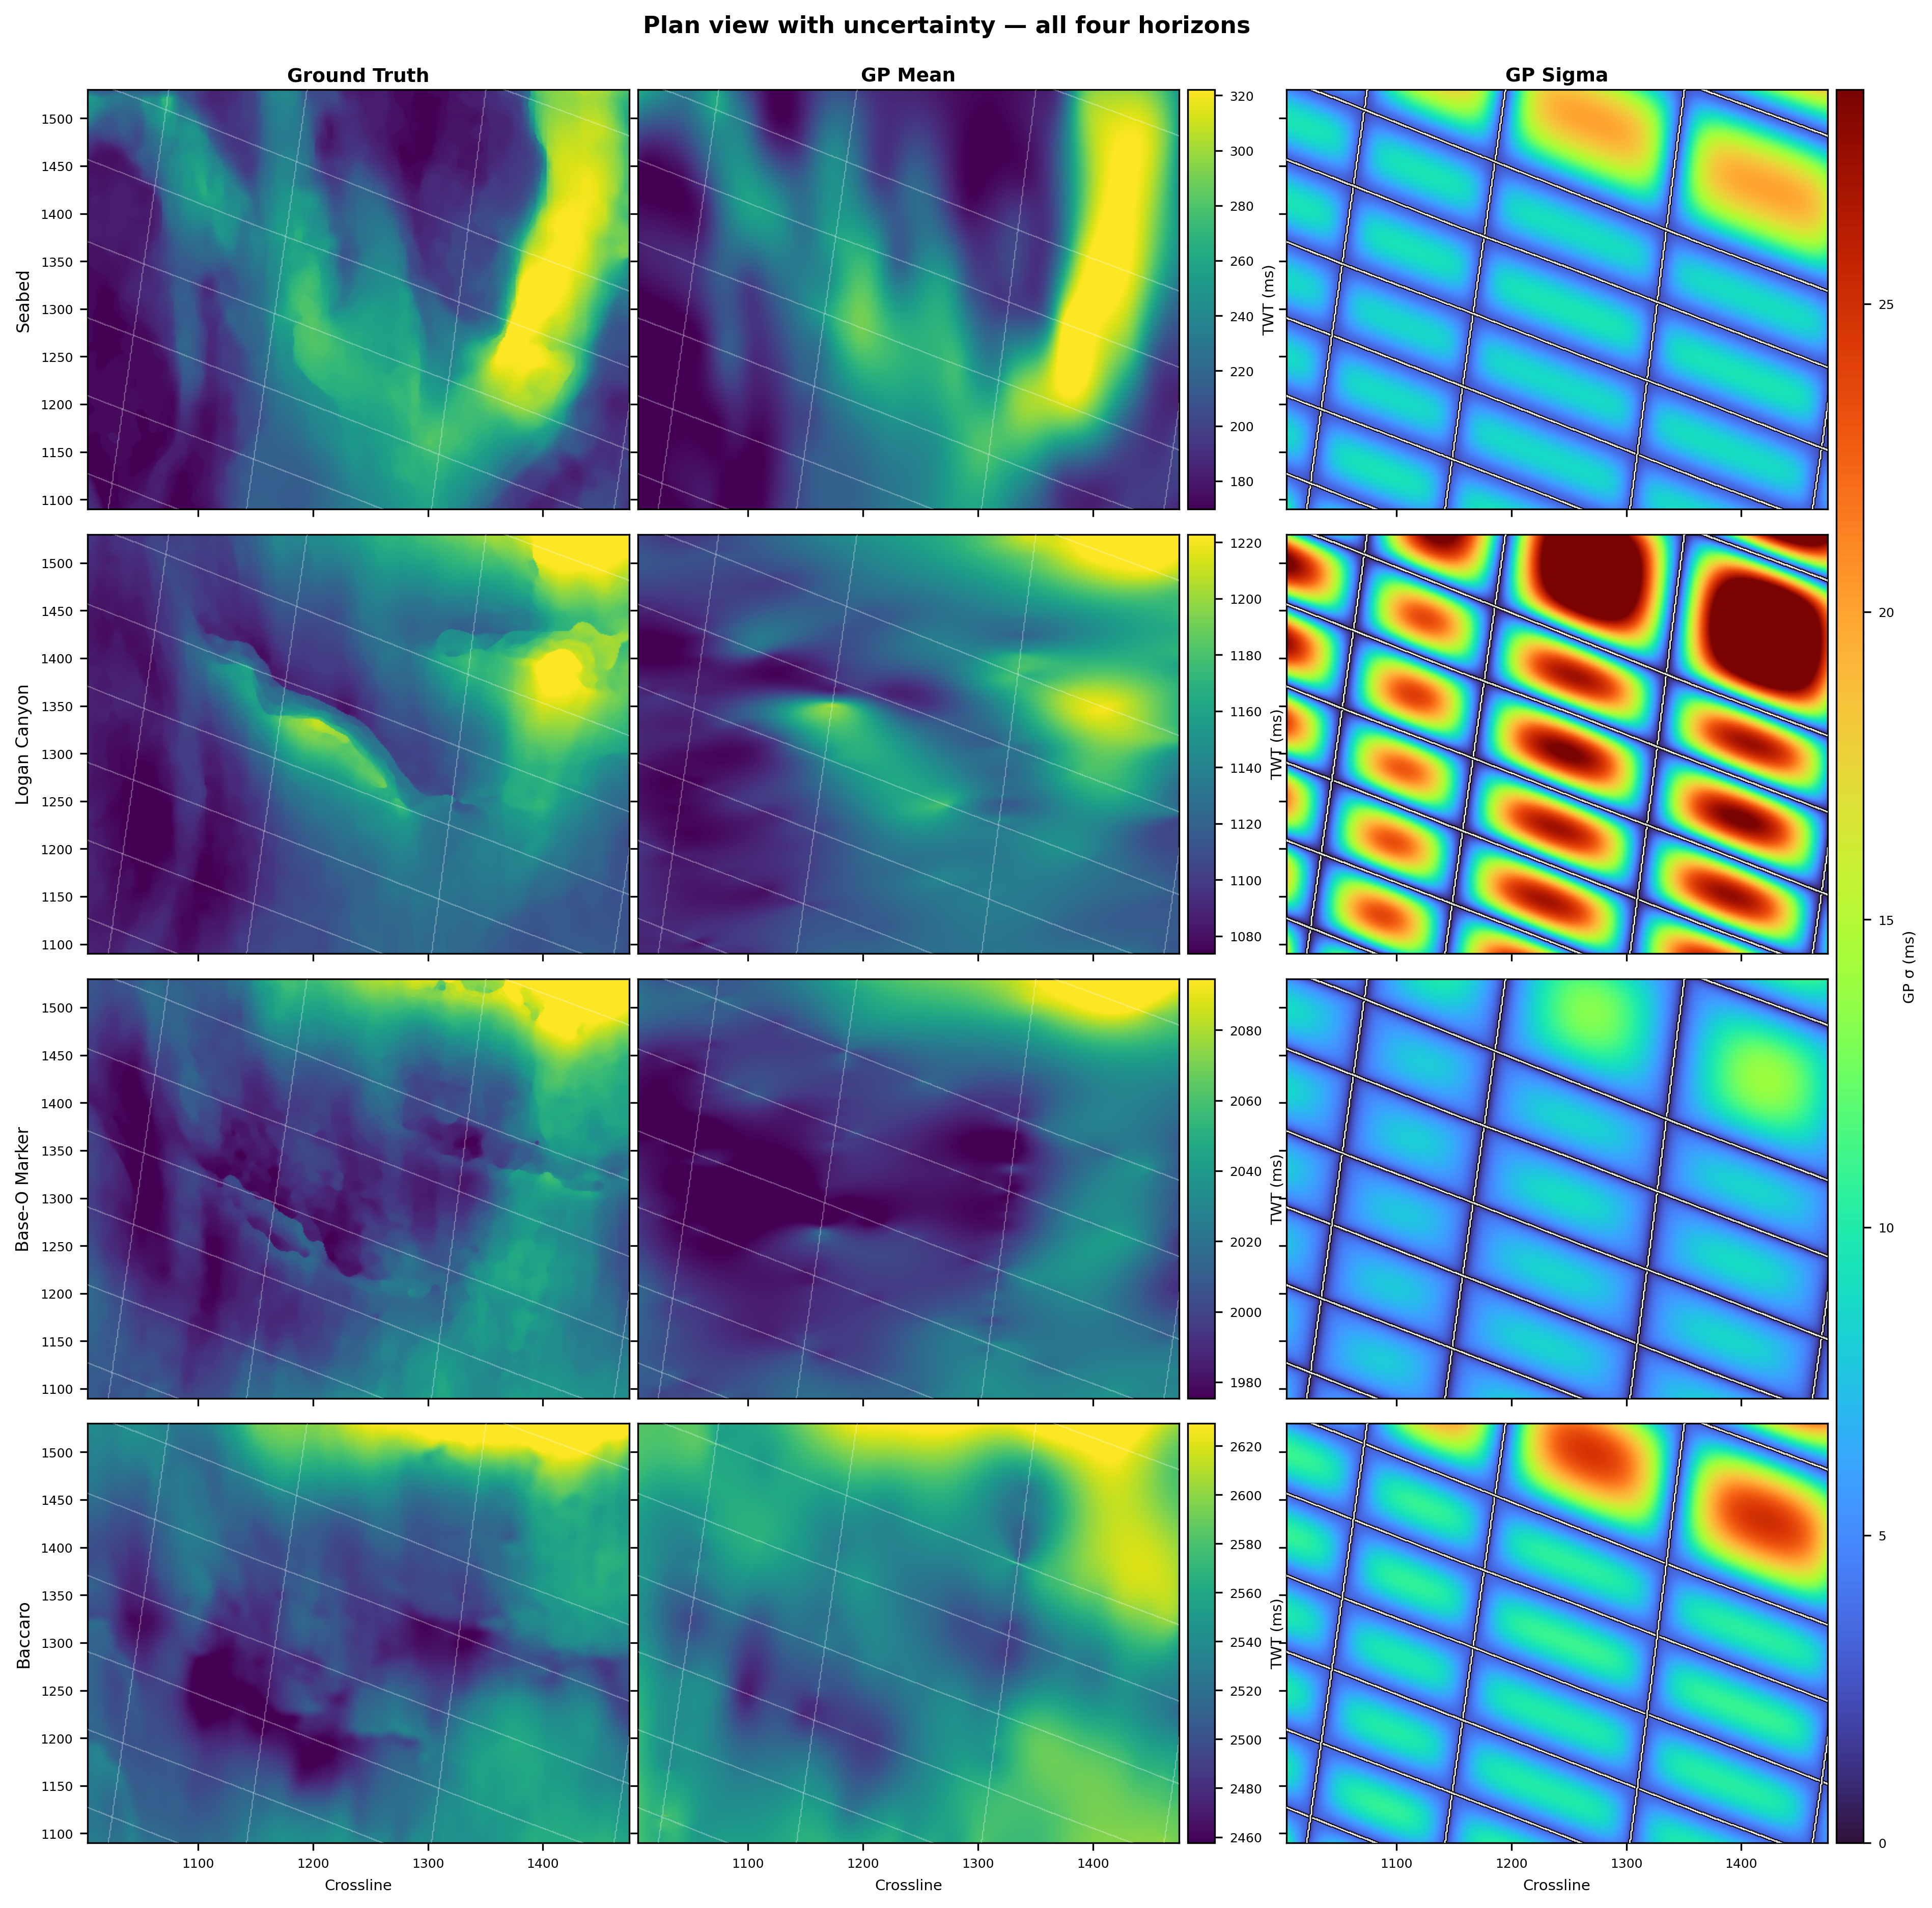
The low-σ stripes coincide with the faint 2D-acquisition tracks overlaid on each panel: the intersecting C-lines and lines 44–47 produce the oblique-grid pattern of low-σ corridors visible on every horizon. Where σ is high between line crossings, the divergence between GP Mean and Truth grows visibly — Logan Canyon's central fault, sharply expressed in the Truth panel, is muted in the GP Mean's smoother reconstruction exactly in those high-σ zones. The next section quantifies the calibration claim against held-out picks.
Calibrated uncertainty
A point estimate without calibrated uncertainty is half a result. The probabilistic reconstruction is validated by 20 %-random-pick cross-validation: we hold out 20 % of the 2D picks per horizon, refit the GP on the remainder, and measure what fraction of the held-out picks fall inside the GP's 80 % credible band. For a well-calibrated posterior, that fraction should land within ±5 percentage points of 80 %.
All four target horizons pass that gate after per-horizon kernel selection.
| Horizon | Kernel | RMS at picks | 80 % band coverage | Reading |
|---|---|---|---|---|
| Seabed | Single anisotropic | 2.98 ms | 81.0 % | Calibrated |
| Logan Canyon | Multiscale | 2.82 ms | 79.6 % | Calibrated |
| Base-O Marker | Multiscale | 1.22 ms | 80.0 % | Calibrated |
| Baccaro | Multiscale | 2.04 ms | 78.8 % | Calibrated |
All four sit inside the gate (coverage ∈ [75 %, 85 %]). RMS against held-out picks is below the data's 4 ms sample interval on every horizon. The multiscale kernel is selected for the three deeper, structurally richer horizons where short-wavelength character (channels, fault expression) coexists with smooth regional dip; the seabed's single-scale variogram is matched by one anisotropic kernel.
Stage 1a outcome. Four horizons reconstructed with calibrated uncertainty empirically validated against held-out picks — including Baccaro, where the GP calibration holds despite the input-pick bias documented above. The deliverable is a per-horizon posterior — mean, per-location uncertainty, and P10 / P50 / P90 samples — over the full 3D survey grid. When the model claims four-out-of-five confidence, the data lands in that band on four of every five locations. Operators can size risk against the band.
Stage 1b · Neural network refinement
The calibrated probabilistic baseline from Stage 1a recovers the long-wavelength regional structure where the 2D data sits, with a calibrated uncertainty band over the rest of the grid.
The GP alone cannot reconstruct the short-wavelength geological character — channel boundaries, fault expression, dip changes. ORCA's U-Net, leveraging learned geological priors, refines the surface to recover that short-wavelength character without disturbing the calibrated band the GP provides.
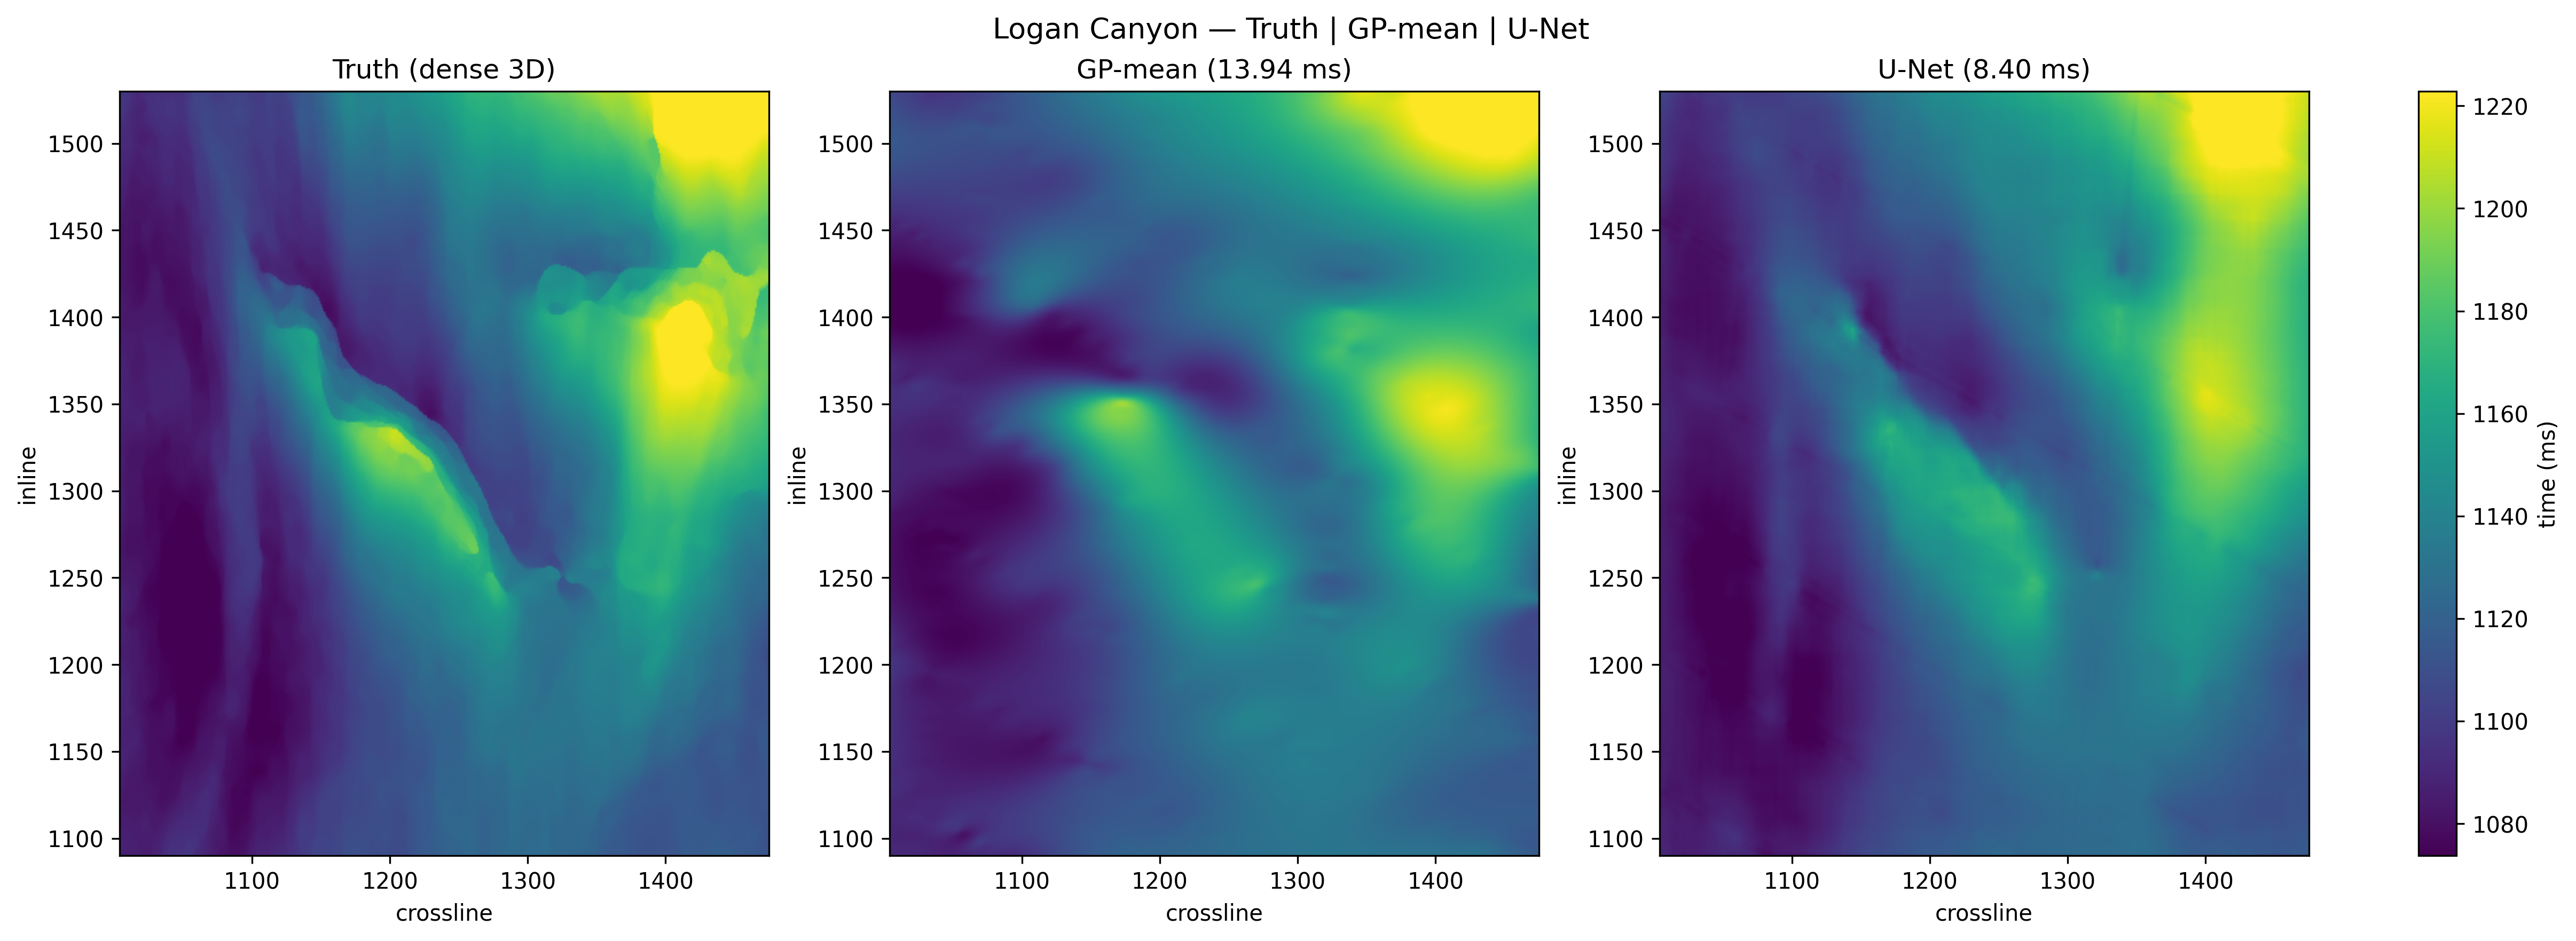
The result reported here is for logan_canyon — selected as the test case because it carries the richest short-wavelength geological character of the four target horizons. The diagonal fault through the middle of the surface is now discernible, and the channel feature along the western edge begins to emerge — neither is visible in the GP-mean baseline.
Plan view
Aggregate accuracy
On logan_canyon, the U-Net reconstruction reduces RMS error against dense 3D ground truth from the GP-mean baseline's 13.94 ms to 8.40 ms — a 39.7 % improvement on the smooth baseline. The aggregate improvement is concentrated in structurally lively regions; on featureless terrain the smooth baseline is comparable or slightly better.
| Surface | GP-mean RMS vs truth | U-Net RMS vs truth | Improvement |
|---|---|---|---|
| Logan Canyon | 13.94 ms | 8.40 ms | −39.7 % |
Stage 1b outcome. A refined horizon surface that preserves Stage 1a's calibrated uncertainty while recovering the short-wavelength character classical smoothing can't extract — the substrate Stage 2 builds on.
Stage 2 · Seismic-volume reconstruction
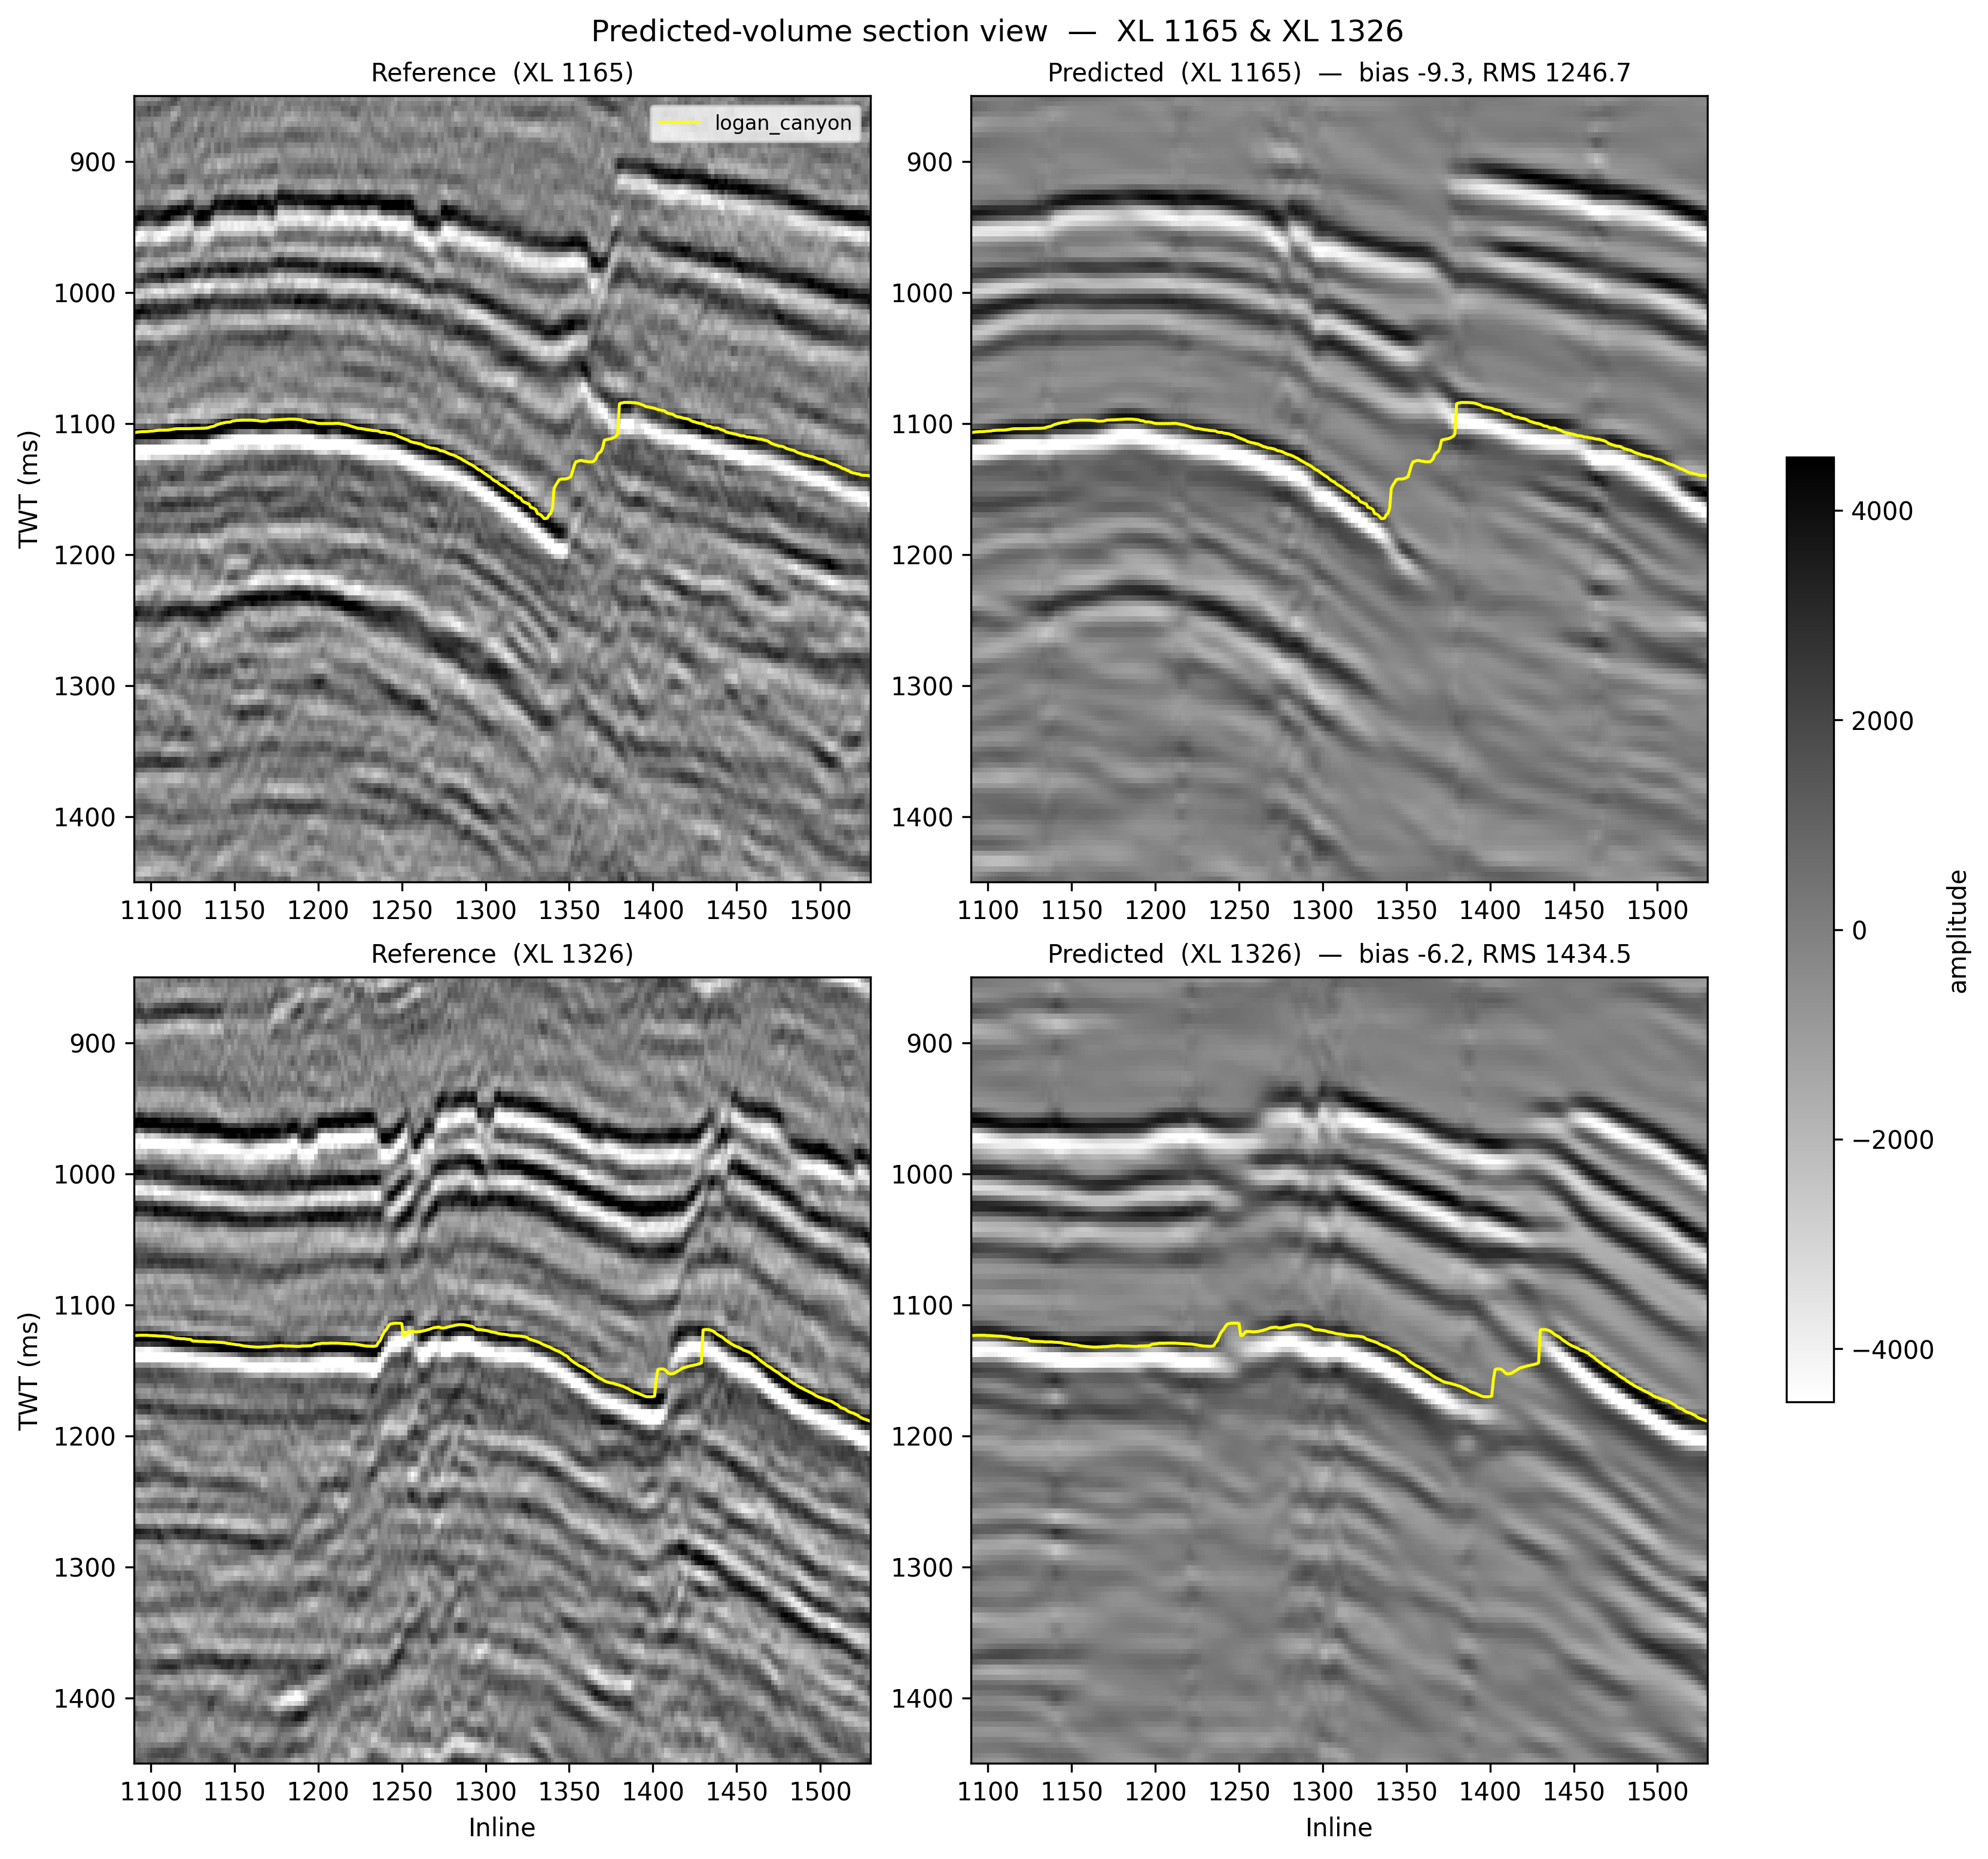
The same workflow scales from horizons to the full seismic volume — a substantially harder, underspecified problem where 2D coverage constrains only a small fraction of the volume and the rest must be inferred. ORCA's neural network produces a predicted volume from the sparse 2D traces, filling the inter-line gaps. Validated against the dense 3D ground truth, the predicted volume recovers the reference's reflector character.
Section view
Plan view
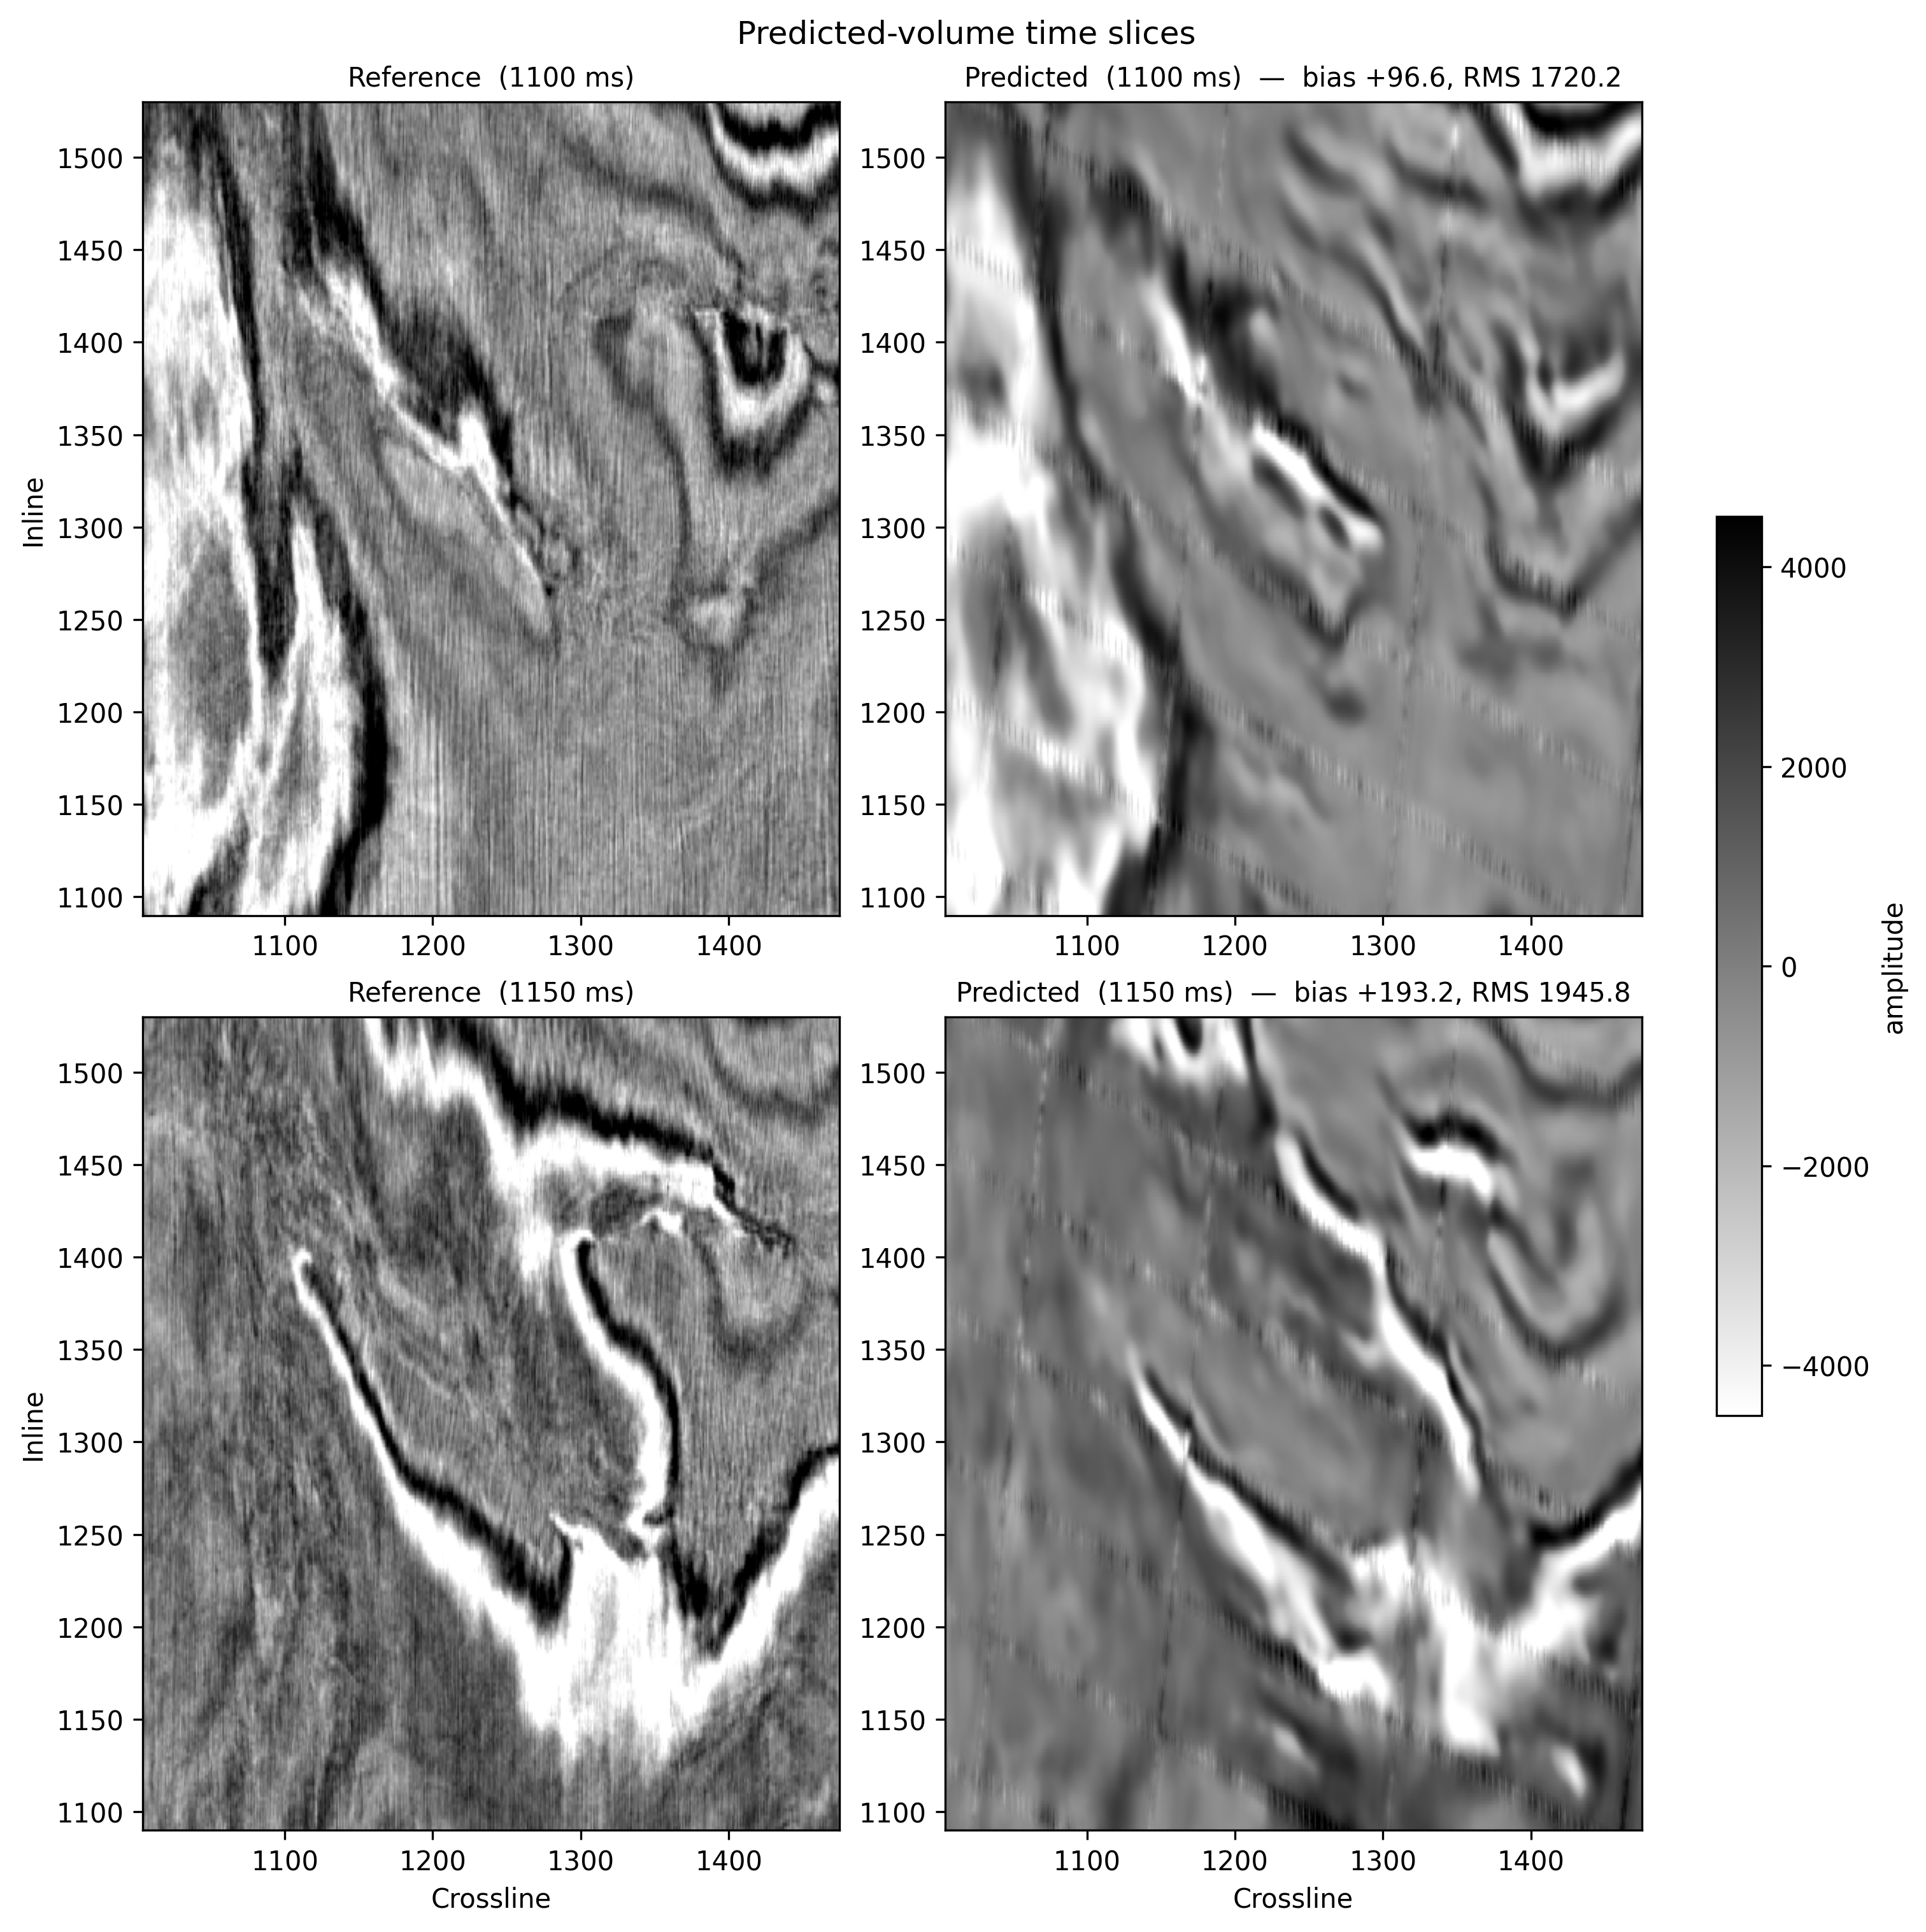
Stage 2 outcome. A first-pass seismic volume that recovers the geological structure interpretable against held-out 3D truth at the two diagnostic crosslines and at the two time slices closest to the logan_canyon target. The workflow's machinery scales from horizons to volumes; the section-view fidelity is meaningful, the time-slice fidelity (larger bias, smoother amplitude character) is the next axis of improvement.
Classical interpretation gives one answer per horizon. The probabilistic reconstruction gives a distribution of answers — each consistent with the 2D data and the prior — with the spread quantifying what the data constrains versus what the prior assumes. The neural refinement recovers the short-wavelength character classical smoothing methods cannot extract from sparse 2D lines. The same workflow scales to the seismic volume, where the immediate deliverable is structural recovery against held-out 3D truth. Together these map directly to gross-rock-volume distributions for reservoir economics, to the value-of-information case for acquiring additional 3D coverage, and to the explicit uncertainty quantification regulators increasingly require for CCUS site approval.
Honest limits
This case study reports the workflow's state as of EAGE 2026 on the open-source Penobscot dataset, where 3D ground truth permits validation. The Stage 1b neural refinement number is reported on a single horizon (logan_canyon); multi-surface aggregate results are forthcoming. The Stage 2 volumetric reconstruction is a first-pass result: structural character is recovered, but numerical fidelity at time-slice scale is the next axis of improvement. Generalization across geological provinces is not established — the Penobscot validation is confined to a single passive-margin clastic setting; performance in salt basins, carbonate platforms, or thrust belts is an open question addressed by the broader method roadmap. Commercial deployment without 3D ground truth — the typical operator scenario — is the subject of a separate validation track.
Acknowledgments
Penobscot is a publicly released dataset made available through the Nova Scotia Department of Natural Resources. The 2D and 3D seismic data, well logs, and interpretations used in this case study are open-source and freely redistributable for research and demonstration.